dashboards and apps you will actually open.
the numbers you keep in four spreadsheets, on one screen, updating themselves.
from the first idea to the server it runs on. we write it, test it and put it live; you get an address that works.
what we build
- analytics dashboards — sales, stock, traffic, whatever you measure
- small business tools: records, orders, bookings, rotas
- internal tools that replace the spreadsheet everyone copies from
- live displays for a reception, a workshop or a showroom
- connections to the tools you already use
- hosting, backups and keeping it up to date
a smaller tool is often a few weeks rather than months. tell us what you do by hand today.
what that looks like
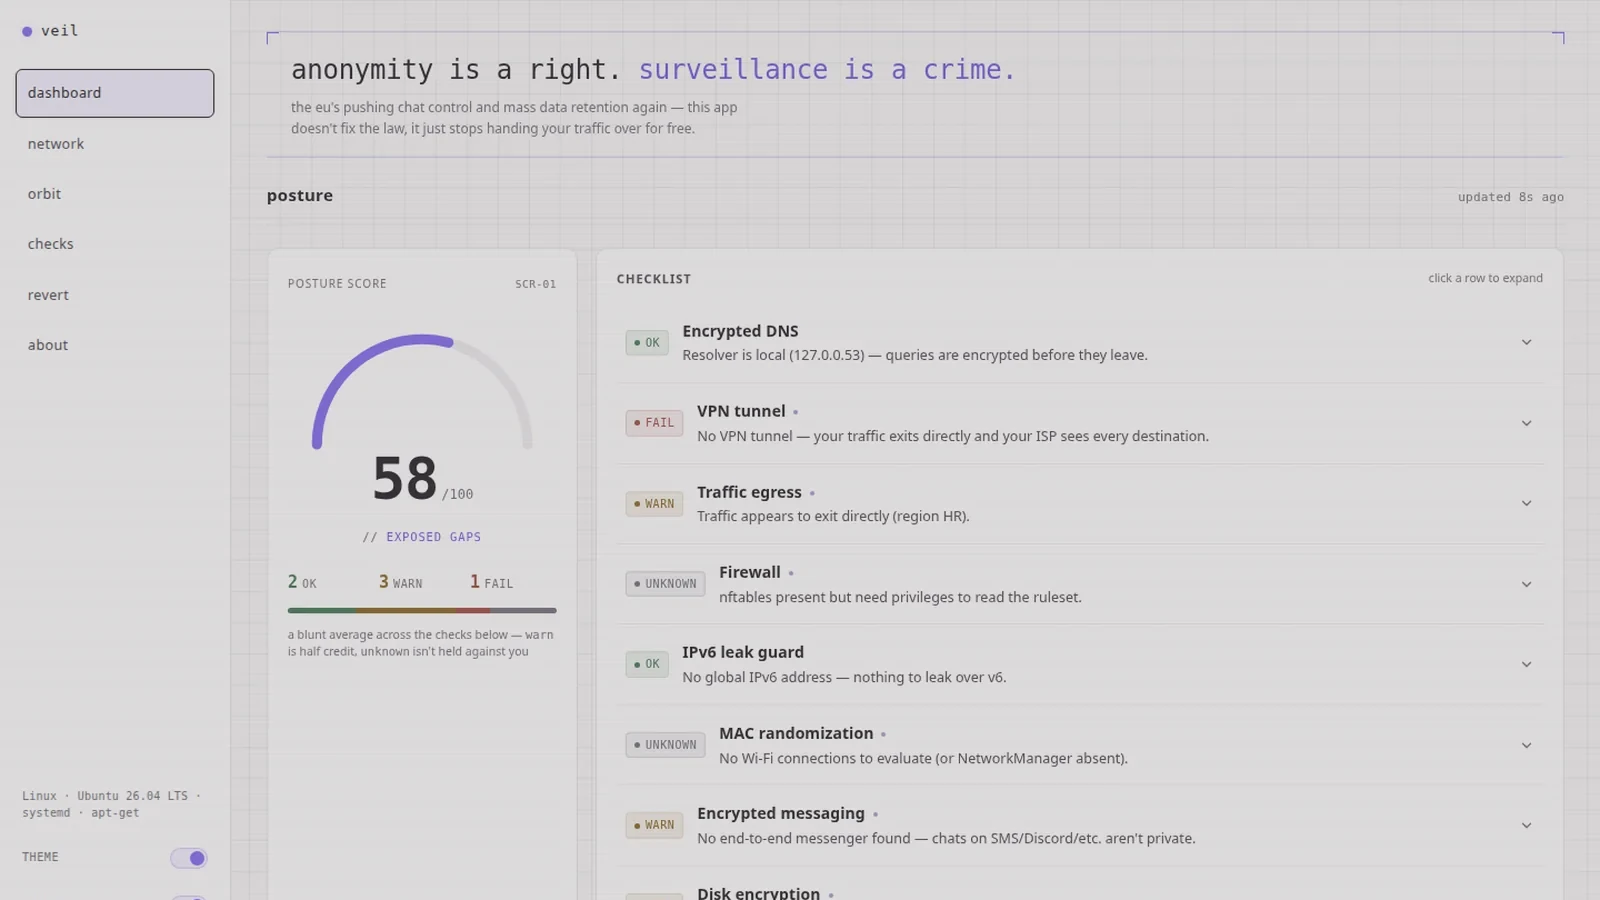
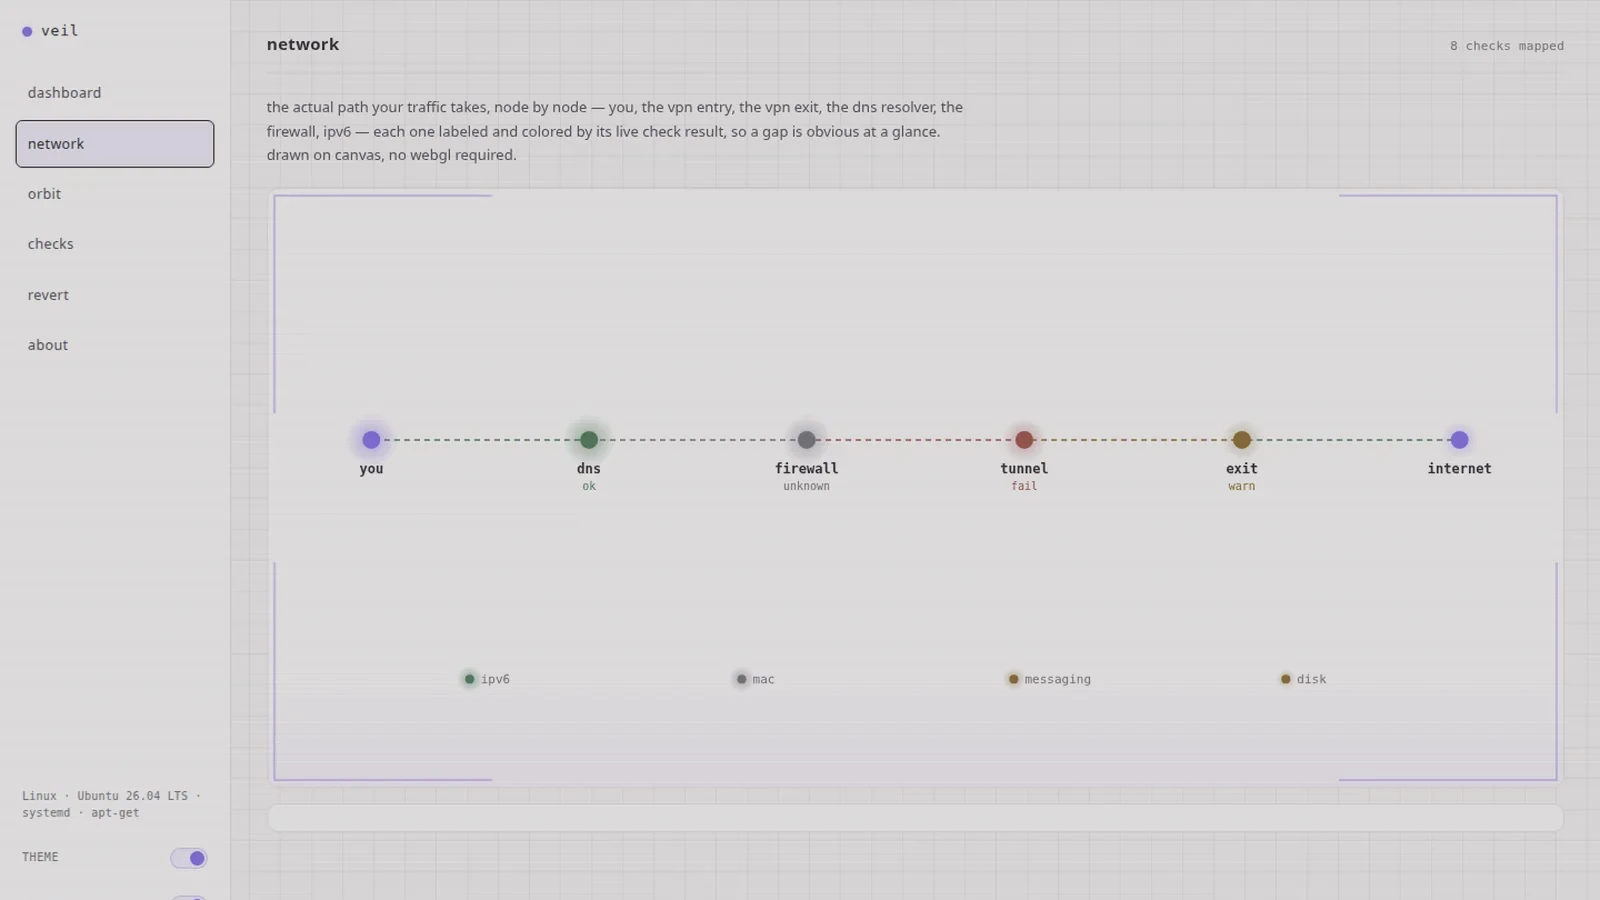
veil is one of ours: it reads the state of a machine and shows it as a score, a list of checks and a map of the route your traffic takes. nothing is guessed — what it cannot determine, it says it cannot determine.
the same approach, pointed at your numbers.
how it goes
-
01
what you measure
show us the spreadsheet or the process you run by hand. the list of screens comes out of that.
-
02
the first screen
we build one page with your real data first, so you can see whether it is pointed the right way.
-
03
the build
the rest arrives in small pieces, each one in front of you as it lands.
-
04
going live
we put it on a server, set up backups and show you how to run it.
tell us what you do by hand
describe the process and we will say whether it is worth automating.